Global Sales Report
Analysis of Sales Report Dashboard
Executive Summary:
This Sales Report provides a high-level overview of sales performance across multiple dimensions, including year, product category, subcategory, and shipping mode. Overall sales performance shows a positive trend, but areas of concern regarding profitability and shipping efficiency require further investigation and action.
Detailed Findings:
1. Overall Sales Performance:
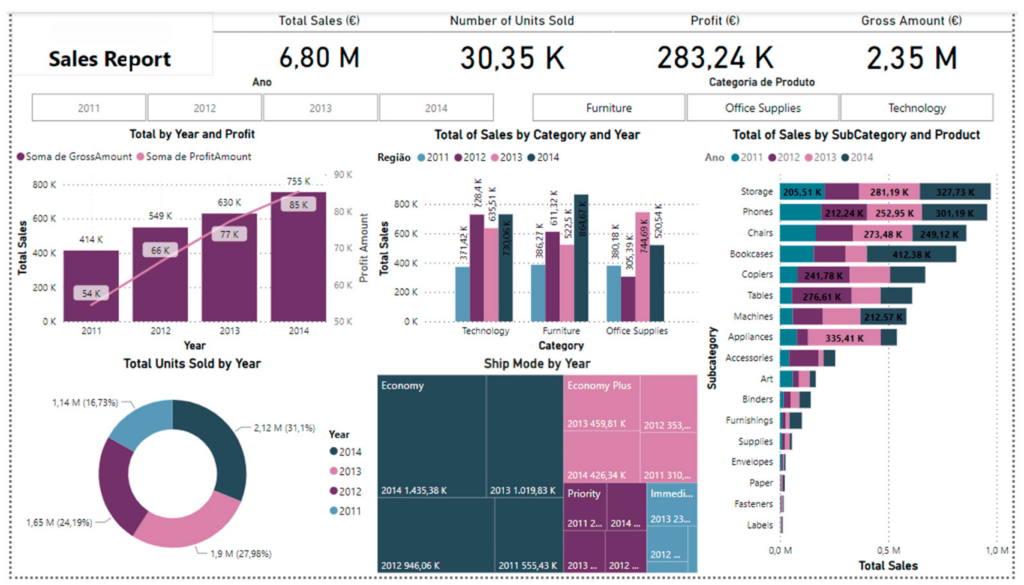
- Total Sales: The total sales are 6.80 million (currency not specified, but assumed to be Euros (€) based on the Gross Amount label). This is a significant figure and indicates a healthy revenue stream.
- Number of Units Sold: 30.35K units were sold. This metric helps understand the sales volume and can be compared to sales revenue to calculate the average selling price.
- Profit: Total profit is €283.24K. This is a relatively low profit margin compared to the total sales of €6.80M. This warrants further investigation into the cost of goods sold, pricing strategies, and potential areas for cost reduction.
- Gross Amount: The total gross amount is €2.35M, which seems inconsistent with the Total Sales of € 6.80 M. It’s crucial to clarify what “Gross Amount” represents. If it’s the cost of goods sold, it would imply a very high cost of sales. If it’s something else, it needs proper labeling and context.
2. Sales Trends Over Time:
- Total by Year and Profit: The bar chart “Total by Year and Profit” shows a clear upward trend in total sales from 2011 to 2014. However, the profit amount does not increase proportionally with sales, especially between 2013 and 2014, when sales increased significantly, but profit only showed a modest increase. This is a crucial area to investigate.
- Total Units Sold by Year: The pie chart “Total Units Sold by Year” shows the distribution of units sold across the years. 2014 has the highest proportion of units sold (31.1%), followed by 2013 (27.98%), 2012 (24.19%), and 2011 (16.73%). This suggests increasing sales volume over time.
3. Sales by Category and Year:
- Total Sales by Category and Year: The stacked bar chart “Total Sales by Category and Year” shows the sales performance of each product category (Technology, Furniture, Office Supplies) over the years. Technology consistently has the highest sales, followed by Furniture and Office Supplies. The chart reinforces the overall sales growth trend across all categories. However, the exact profit contribution of each category is not immediately clear and should be added.
4. Sales by Subcategory and Product:
- Total Sales by SubCategory and Product: The horizontal bar chart “Total Sales by SubCategory and Product” provides a detailed breakdown of sales by subcategory. “Phones” and “Storage” in the Technology category show the highest sales, followed by “Chairs” in Furniture and “Appliances” in Office Supplies. This chart is valuable for identifying top-performing and potentially underperforming subcategories and products.
5. Shipping Mode:
- Ship Mode by Year: The “Ship Mode by Year” section shows sales by shipping mode (Economy, Economy Plus, Priority, Immediate) over the years. “Economy Plus” and “Priority” are the dominant shipping modes, but there is a significant amount of “Economy” shipping, particularly in 2012. The profitability and delivery efficiency of each shipping mode should be investigated.
Key Questions for Further Investigation:
- Profit Margins: Why is the overall profit margin relatively low? What are the profit margins for each product category and subcategory?
- Gross Amount Definition: What does “Gross Amount” represent, and why is it significantly lower than total sales?
- Shipping Costs: What are the costs associated with each shipping mode? Are there inefficiencies in the shipping process that are impacting profitability?
- Product Profitability: Which subcategories and products are most profitable? Which are the least profitable?
- Customer Segmentation: Is there customer segmentation data available? Analyzing sales by customer segment could reveal valuable insights.
- External Factors: Were any external economic or market factors influencing sales during this period?
- Data Accuracy: Is the data accurate and reliable? A data quality check is recommended.
Recommendations:
- Profit Margin Analysis: Conduct a detailed analysis of profit margins at the category, subcategory, and product level. Identify factors contributing to low margins (e.g., high costs, low pricing).
- Cost Reduction Strategies: Implement cost reduction strategies in areas that contribute to low profit margins (e.g., negotiating with suppliers to optimize shipping processes).
- Pricing Review: Review the pricing strategy for each product, particularly for high-volume, low-profit items. Consider adjusting prices to improve profitability.
- Shipping Optimization: Analyze the cost-effectiveness and delivery times of different shipping modes. Optimize shipping selections to balance cost and customer satisfaction.
- Inventory Management: Analyze inventory levels and turnover rates for each product. Optimize inventory management to reduce storage costs and minimize waste.
- Marketing Focus: Focus marketing efforts on high-profit margin products and subcategories.
- Data Validation: Verify the accuracy of the data, especially the “Gross Amount” figure.
- Further Data Acquisition: Acquire additional data, such as customer segmentation, marketing spending, and competitor pricing, to gain a more comprehensive understanding of sales performance.