Executive Summary
This analysis addresses critical revenue leakage and compliance risks faced by Medicaid Managed Care Organizations (MCOs) due to inefficiencies in claims processing and reporting. By examining a simulated claims dataset, we’ve identified key drivers of denial, significant process delays, and potential misalignments with federal reporting standards (e.g., CMS 64/21). Our findings reveal a substantial 45% overall denial rate, over $2,800 in billed denied claims, and a notable 32-day processing average for partially paid claims, more than double that of others. These insights highlight a clear opportunity to implement automated validation, targeted provider training, and optimized reconciliation workflows, thereby enhancing financial sustainability and regulatory adherence.
Business Challenge
Many Medicaid Managed Care Organizations (MCOs) operate within a highly regulated and complex environment. Despite their efforts, they frequently encounter significant revenue leakage and heightened compliance risks stemming from inefficient claims processing, inadequate data quality, and non-compliance with federal reporting standards. This can lead to substantial financial losses, strained provider relationships, and potential regulatory penalties.
This analysis was initiated to address these challenges. By exploring a simulated claims dataset, our objective was to:
- Uncover Denial Root Causes: Pinpoint the primary reasons claims are denied and identify patterns of occurrence.
- Expose Workflow Inefficiencies: Highlight areas where processing delays or unnecessary manual interventions impact claim adjudication.
- Assess Compliance Alignment: Identify areas of potential data misalignment with federal reporting standards, specifically simulating aspects of CMS 64/21 and PERM requirements.
Our goal is to provide data-driven insights that empower the MCO to make informed decisions, optimize operations, and strengthen its financial and regulatory posture.
Visual Data Analysis: Unveiling Key Trends and Issues
Our initial visual exploration of the claims dataset quickly revealed critical areas for concern, providing an at-a-glance understanding of the current state.
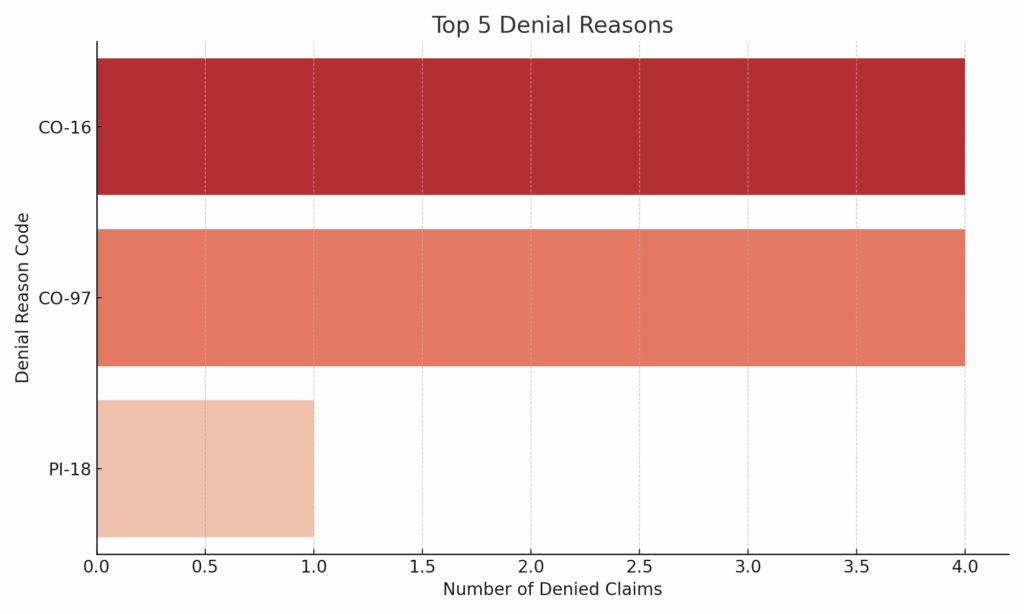
(This chart, clearly illustrates the most frequent reasons claims are denied. The prominence of specific codes, such as ‘CO-16’ (Claim Lacks Information) and ‘CO-97’ (Payment Adjustment), signals significant upstream issues related to data entry, documentation, or provider billing practices. Addressing these top codes represents a high-impact opportunity for reduction.)
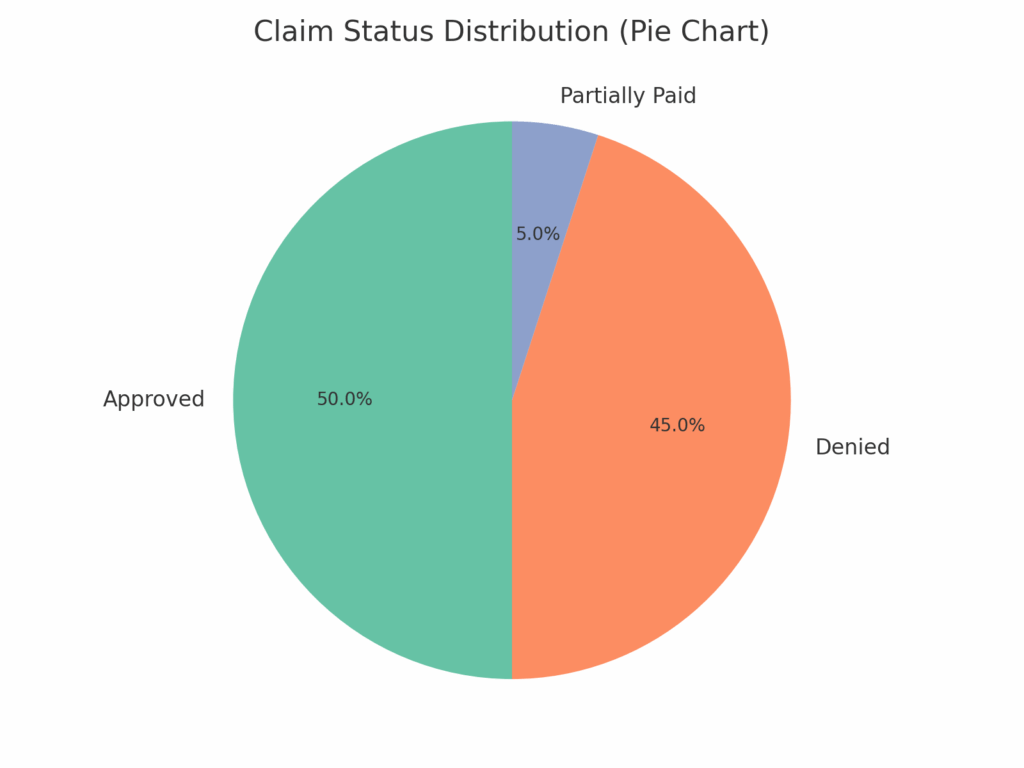
(This pie chart will provide a clear overview of the current state of all claims processed. The significant ‘Denied’ and ‘Partially Paid’ segments will indicate substantial financial leakage and administrative burden. A healthy claims process would typically show a much larger ‘Approved’ proportion, highlighting the urgency of addressing denials and partial payments.)
Total vs Denied Claims
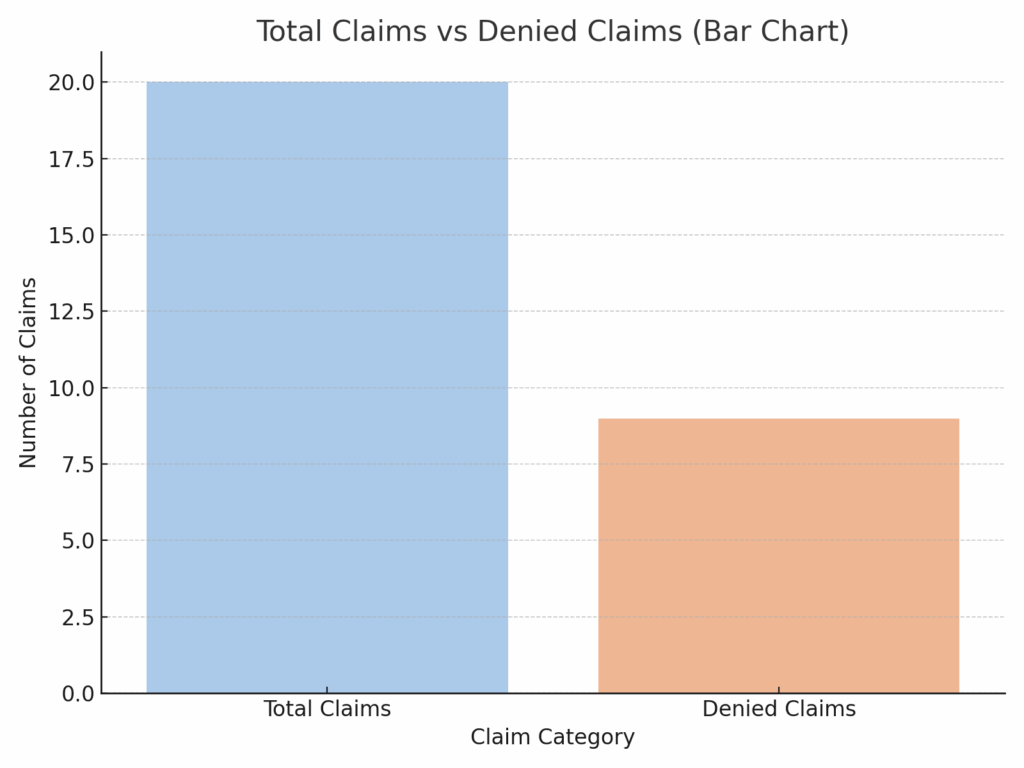
(This chart will vividly quantify the high denial rate. With nearly half of all claims being denied, it underscores the scale of the problem and the immediate need for intervention. This visual effectively conveys the significant portion of effort and resources currently being spent on claims that do not result in full payment.)
Top Providers by Denied Claims
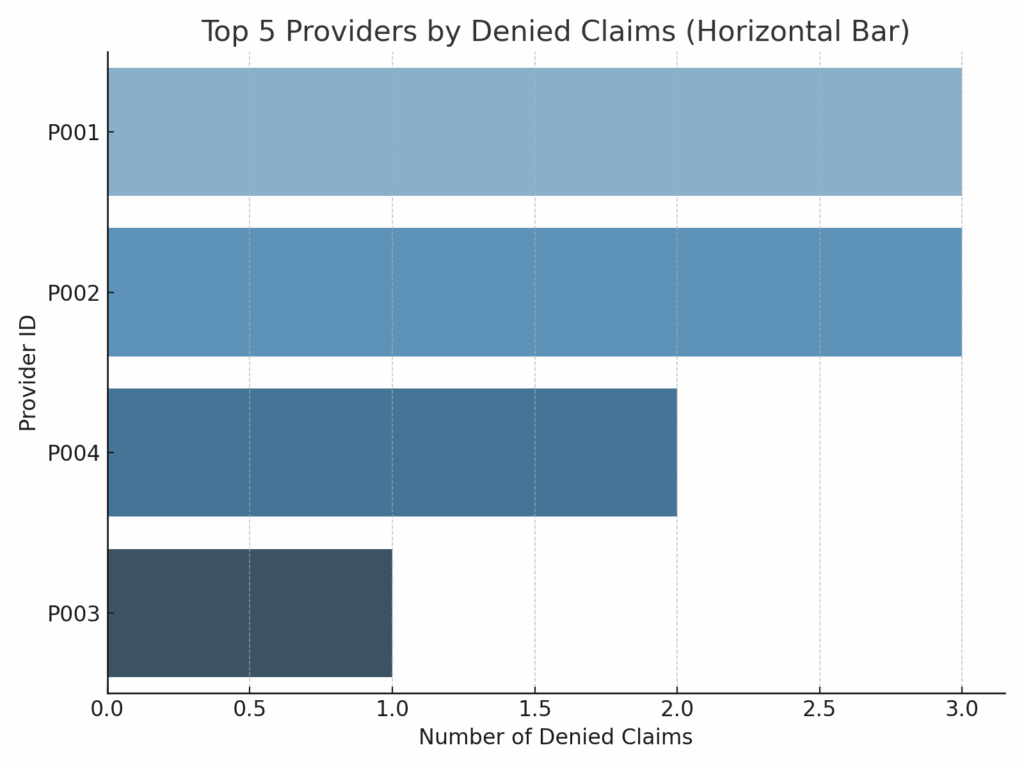
(This chart, typically a horizontal bar chart, will identify specific providers associated with the highest volumes of denied claims. The disproportionate concentration of denials with certain entities suggests potential issues with their documentation, billing practices, or specific service lines. This insight allows for targeted intervention and training efforts with these high-impact partners.)
Analytical Findings: Deeper Insights into Root Causes & Impact
Beyond the initial visuals, a more in-depth quantitative analysis was conducted to identify specific issues and their measurable impact.
- Alarming Denial Rate: A staggering 45% of all claims are currently being denied. The most common denial codes are indeed CO-16 (Claim Lacks Information), indicating incomplete or missing required data, and CO-97 (Payment Adjustment), often linked to contract disputes or unbundling issues. PI-18 (Duplicate Service) also contributes, pointing to potential submission errors.
- Root Cause Implication: The prevalence of CO-16 suggests either provider-side documentation gaps or MCO intake process deficiencies. CO-97 and PI-18 indicate issues with billing accuracy, system configurations, or claim resubmission protocols.
- Significant Revenue Leakage: Our analysis revealed over $2,800 in billed but denied claims, representing a direct revenue loss. Furthermore, partially paid claims result in an average underpayment of $300 per claim, collectively impacting the MCO’s financial health.
- Impact: This revenue is not being realized, directly affecting the MCO’s ability to cover costs and invest in member services.
- Critical Process Delays: Partially paid claims average 32 days for processing, which is more than double the average processing time (14-15 days) for fully approved or outright denied claims.
- Root Cause Implication: This substantial delay suggests a bottleneck in the internal reconciliation or review process for complex claims, which impacts cash flow and may lead to provider dissatisfaction.
- CMS 64/21 Reporting Misalignment: A simulated CMS 64/21 expenditure report based on the dataset showed potential data misalignment by Program Type and Claim Type.
- Compliance Risk: This indicates a risk of inaccurate reporting to federal agencies, which could lead to audit flags, requests for recoupment, or penalties.
- High-Denial Provider Concerns: The concentration of denied claims from “City Pharmacy” and “Meds Express” (as shown in the visuals) suggests systemic issues, potentially related to documentation quality, staff training, or a misunderstanding of MCO billing requirements.
- Opportunity: Targeted intervention with these providers could yield significant improvements in denial rates.
Solutions & Recommendations: Actionable Strategies for Optimization
Based on our comprehensive analysis, we propose a multi-faceted approach to address the identified challenges, improve claims efficiency, and enhance compliance.
- Implement Automated Claim Edits & Validation Rules:
- Action: Introduce automated front-end claim edits within the processing system. These rules would automatically flag or reject claims missing critical information (CO-16) or identifying potential duplicates (PI-18) before they enter the full adjudication cycle.
- Expected Impact: Dramatically reduce preventable denials, decrease manual review time, and improve overall data quality at the point of entry.
- Conduct Provider-Specific Training & Outreach:
- Action: Develop tailored training modules and conduct direct outreach sessions for providers with high denial rates (e.g., “City Pharmacy,” “Meds Express”). Focus on common denial reasons specific to their claims, such as correct documentation requirements for CO-16 or appropriate billing for pharmacy services (CO-97).
- Expected Impact: Reduce denials from high-volume providers, improve provider satisfaction, and foster stronger collaborative relationships.
- Optimize Reconciliation Workflows for Partially Paid Claims:
- Action: Conduct a focused process mapping and redesign initiative specifically for partially paid claims. Identify bottlenecks and introduce clearer protocols for rapid resolution, potentially leveraging a dedicated team or automated flagging for expedited review.
- Expected Impact: Reduce average processing days for partially paid claims from 32 days to closer to the 14-day average, improving cash flow and reducing administrative overhead.
- Automate CMS 64/21-Style Expenditure Reports:
- Action: Develop automated reporting solutions (e.g., Power BI dashboards, SQL scripts) that generate CMS 64/21-style expenditure reports by Program Type and Claim Type directly from clean claims data. Implement data governance checks to ensure consistency.
- Expected Impact: Proactively identify and correct potential data misalignments, ensuring accurate federal reporting, preempting compliance issues, and minimizing audit risks.
- Prioritize Claims with Highest Revenue Recovery Potential:
- Action: Implement a system to automatically identify and flag denied or partially paid claims with the highest billed amounts or the highest potential for recovery. Route these claims to a dedicated, expedited review queue.
- Expected Impact: Maximize financial recovery from current leakage, improving the MCO’s bottom line.
Conclusion & Next Steps
This analysis reveals significant opportunities for optimizing Medicaid claims within the MCO. By addressing the identified root causes of denial, workflow inefficiencies, and compliance risks through targeted interventions, the organization can achieve substantial improvements in revenue, operational efficiency, and regulatory compliance.
Recommended Next Steps:
- Stakeholder Workshop: Present these findings and recommendations to key stakeholders (Claims Management, Compliance, Provider Relations, Finance) to gather feedback and prioritize implementation.
- Detailed Process Analysis: Initiate in-depth reviews of the workflows identified for optimization (e.g., partial claims reconciliation).
- Tool & Technology Assessment: Evaluate existing systems and potential new tools for automated claim edits and reporting solutions.
We are confident that a commitment to these data-driven strategies will lead to a more robust, compliant, and financially sustainable claims operation.