Executive Summary
This analysis presents a strategic approach to transforming fragmented project tracking data into a centralized, collaborative Business Intelligence (BI) solution, specifically leveraging Google Sheets for accessibility and flexibility. Our objective was to significantly improve project visibility, enhance task efficiency, and optimize employee workload management. Key findings from the simulated dataset reveal critical areas for intervention, including a significant number of ‘At Risk’ and ‘Blocked’ projects, potential budget overruns, and resource overutilization in key departments. This BI framework empowers organizations to move from reactive project management to proactive governance, enabling real-time monitoring, strategic alerting, and efficient resource alignment to ensure successful project delivery and sustained operational health.
Business Challenge: Transforming Fragmented Project Data into Actionable Intelligence
Many organizations, particularly those managing multiple projects concurrently, face significant challenges due to fragmented and manual project tracking processes. This often results in:
- Limited Project Visibility: Difficulty in gaining a holistic, real-time view of overall portfolio health, making it challenging to identify “at-risk” projects proactively.
- Inefficient Task Management: Bottlenecks in workflows, overdue tasks, and communication gaps that delay project milestones and impact productivity.
- Suboptimal Resource Utilization: Challenges in effectively managing team workloads, leading to burnout from over-utilization or wasted capacity due to under-utilization.
- Reactive Decision-Making: Reliance on outdated or incomplete data, forcing leadership into “firefighting” mode rather than strategic planning.
This analysis focuses on addressing these pain points by demonstrating how a well-structured BI solution, even utilizing accessible tools like Google Sheets, can centralize project data and unlock powerful insights for proactive project governance.
Project Health Overview: Gauging Portfolio Status and Financial Adherence
To assess the overall health of the project portfolio, we examined critical dimensions including status distribution, budget adherence, and deadline performance. These visuals provide an immediate snapshot for stakeholders.
Project Status Distribution
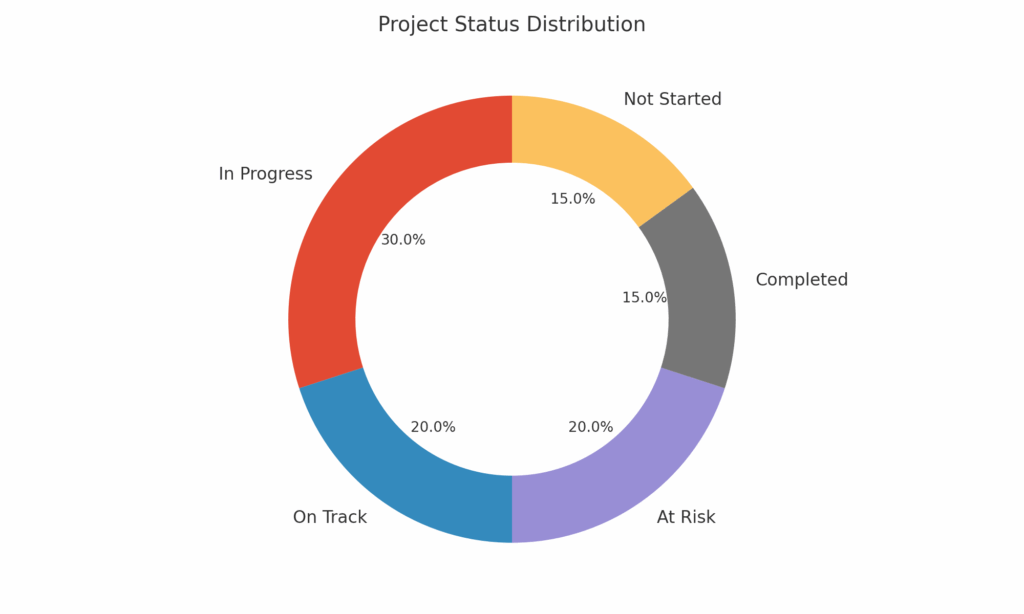
(This donut chart provides an immediate and clear breakdown of current project statuses across the entire portfolio. The significant proportions of ‘In Progress’ and ‘Not Started’ projects are typical; however, the ‘At Risk’ segment (20%) signals a notable portion of the portfolio that requires urgent attention. This visual empowers stakeholders to quickly identify and prioritize interventions for projects that deviate from expected trajectories.)
Top 5 Projects: Budget vs. Actual Cost
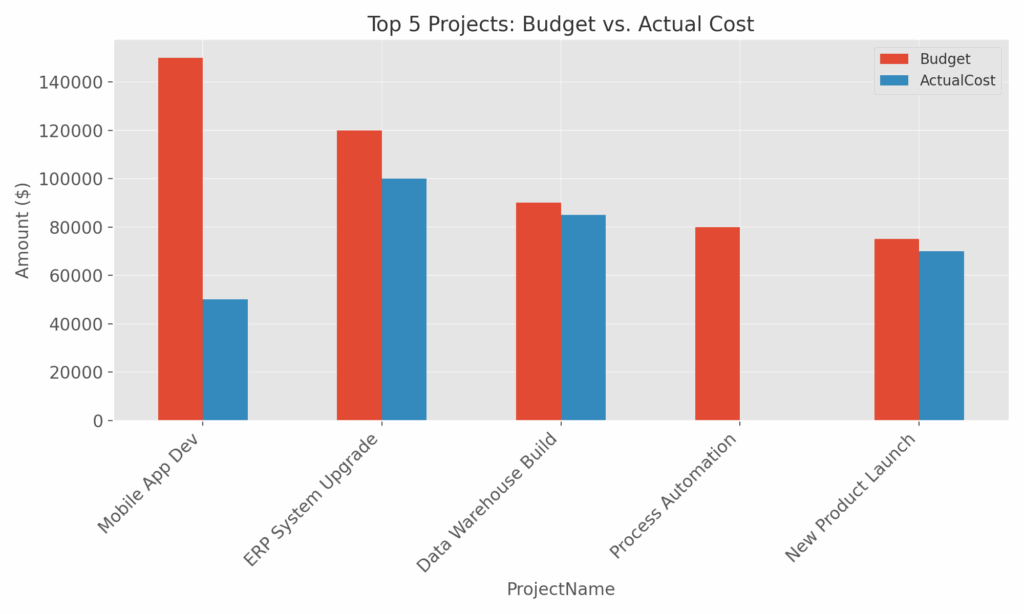
(This bar chart critically compares the allocated budget against actual expenditures for the top five projects by total cost. Discrepancies, particularly where actual costs are approaching or exceeding budget (e.g., ‘ERP System Upgrade’), highlight potential financial performance issues. Projects with significant budget variances necessitate immediate review of resource allocation, scope, or planning assumptions to prevent overruns.)
Task & Workflow Efficiency: Uncovering Operational Bottlenecks
Understanding the progress and impediments within individual tasks is crucial for maintaining project momentum and identifying systemic workflow inefficiencies.
Task Status Distribution
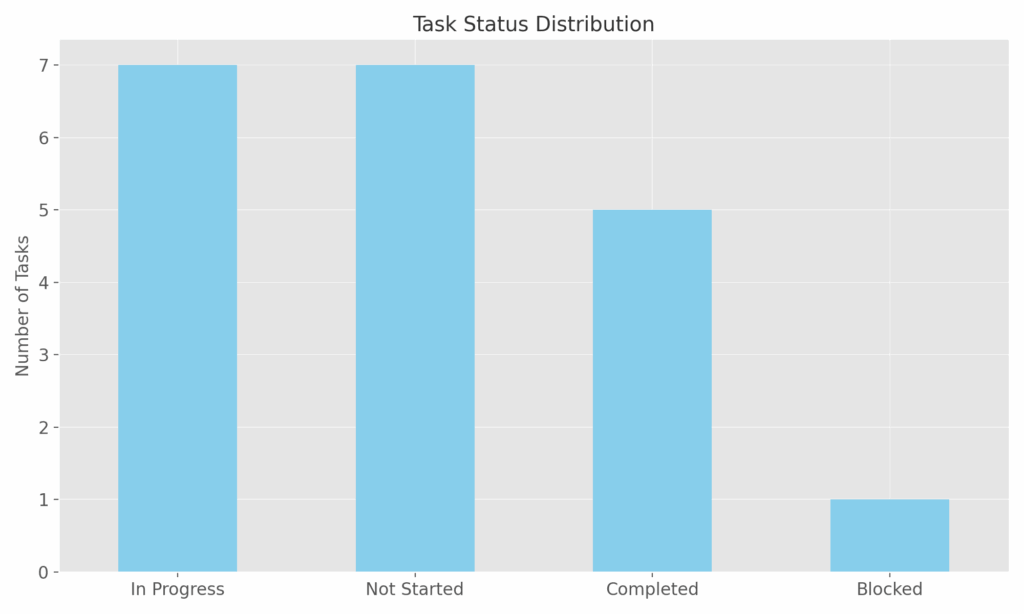
(This bar chart provides a crucial snapshot of task progress across all active projects. While ‘In Progress’ and ‘Not Started’ tasks are expected, the presence of ‘Blocked’ tasks (though small in this sample, it’s disproportionately impactful if it represents a critical path) indicates significant workflow impediments. A substantial volume of ‘Blocked’ or ‘Overdue’ tasks (which would be tracked here) could suggest systemic workflow inefficiencies, inter-departmental bottlenecks in communication, or unresolved dependencies requiring proactive intervention.)
Team Resource Management & Performance: Optimizing Workload and Productivity
Effective project delivery hinges on the optimal management of human capital. Analyzing resource utilization and individual task performance reveals critical insights for workload balancing and identifying support needs.
Average Actual Hours Logged by Department
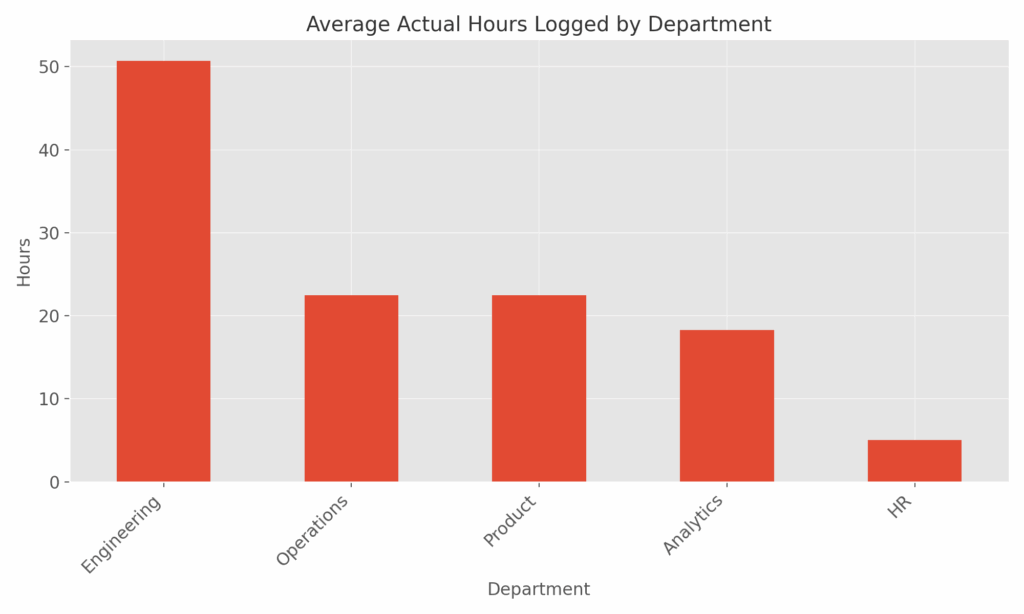
(This department-level analysis of average actual hours logged identifies potential over- or under-utilization trends. For instance, the ‘Engineering’ department shows significantly higher average hours, which could indicate sustained over-utilization, unrealistic planning assumptions, or potential burnout risks. Consistent overages suggest systemic inefficiencies or a need for re-evaluation of capacity planning.)
Overdue Tasks by Employee
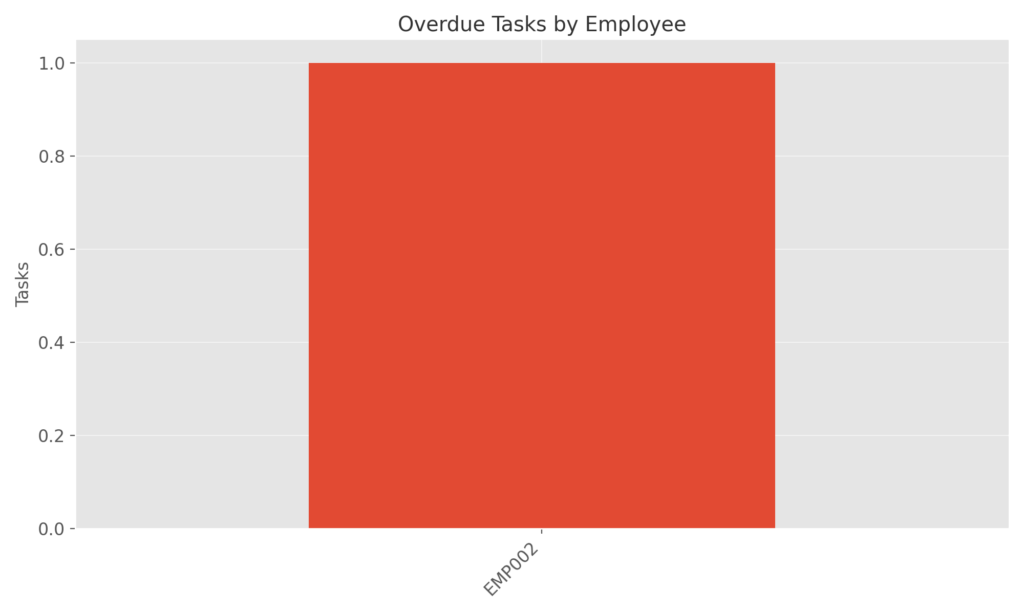
(This chart (or detailed table in an interactive dashboard) provides granular overdue task tracking at the individual employee level. Highlighting specific employees with overdue tasks (e.g., ‘EMP002’ in this sample) allows managers to provide targeted support, investigate potential blockers, or recommend improved time management tools and training. This is a critical metric for proactive workload management and performance support.)
Strategic Recommendations: Building a Proactive Project Governance Framework
Based on these critical insights, we propose a series of strategic recommendations designed to leverage this BI solution for proactive project governance, transitioning the organization from reactive firefighting to strategic oversight.
- Implement Real-time Conditional Formatting & Alerts:
- Action: Configure conditional formatting within Google Sheets dashboards (or your chosen BI tool) to automatically flag ‘At Risk’ projects, ‘Overdue’ tasks, or projects nearing budget limits (e.g., >80% utilized) in real-time.
- Expected Impact: Enable stakeholders to visually identify and address at-risk projects immediately, preventing minor issues from escalating into major problems.
- Automate Proactive Alerts for Critical Metrics:
- Action: Set up automated email or Slack alerts for key thresholds, such as overdue tasks, projects exceeding budget, or critical dependencies becoming ‘Blocked.’
- Expected Impact: Reduce manual monitoring effort and ensure timely intervention by relevant project managers or leaders, fostering a culture of proactive problem-solving.
- Establish Structured Sprint Reviews & Blocked Task Resolution Protocols:
- Action: Introduce regular, perhaps weekly, sprint or project reviews focused specifically on resolving ‘Blocked’ tasks and critical dependencies. Implement clear escalation paths for unresolved blockers.
- Expected Impact: Accelerate task completion, improve workflow efficiency, and reduce project delays caused by unresolved impediments.
- Enhance Collaboration with Integrated Timelines and Status Updates:
- Action: Expand Google Sheets (or integrate with project management tools) to include Gantt-like timelines, facilitating collaborative status updates directly within the dashboard environment. Explore integration with Apps Script for enhanced functionality.
- Expected Impact: Improve cross-functional communication, ensure alignment on project schedules, and provide a single source of truth for real-time progress tracking.
- Reevaluate Resource Planning & Time Tracking Tools:
- Action: Conduct a deeper dive into time tracking and planning tools, especially for departments consistently showing overlogged or under-resourced hours (e.g., ‘Engineering’). This may involve implementing more accurate capacity planning tools or reassessing project estimation methodologies.
- Expected Impact: Optimize team workloads, mitigate burnout risk, and ensure efficient allocation of human resources across the project portfolio.
Conclusion & Next Steps
This Business Intelligence solution demonstrates how even accessible tools like Google Sheets can be powerfully structured to unlock critical insights and facilitate proactive project governance. By focusing on real-time monitoring, strategic alerting, and efficient resource alignment, the organization can transition from reactive firefighting to a highly efficient, data-driven approach to project management.
Recommended Next Actions:
- Stakeholder Alignment Workshop: Present this dashboard and findings to leadership and project managers to gather feedback, confirm priorities, and secure buy-in for implementation.
- Pilot Implementation: Begin phased implementation of automated alerts and new reporting protocols on a pilot project to refine processes and demonstrate immediate value.
- Tool and Process Evaluation: Initiate a review of existing time-tracking and project-planning tools in identified departments to optimize resources and explore options for enhanced capacity planning.
This initiative lays the foundation for a culture of proactive project success, ensuring resources are optimally utilized and strategic objectives are met with greater predictability.